“After a record-setting past few years, the Houston industrial market has returned to pre-pandemic activity levels. On average, the market would absorb roughly 2-4 million square feet each quarter with 7-9 million square feet of leasing activity pre-pandemic. For the first quarter of 2024, the market posted a positive 2.4 million square feet of absorption, with leasing activity at 8.2 million square feet.
Although new product greatly outpaced absorption, the slowdown in new construction starts will offset reduced absorption, resulting in a more sustainable and balanced market going forward with vacancy levels expected to level off.
Even with the slowing conditions, market fundamentals remain strong due to positive growth in population, container volumes at the Port, and overall employment.”, said Danny Rice, President.
2024 Q1 Industrial Houston Report Colliers
Key Takeaways
- First-quarter activity sluggish
- Construction volume continues descent
- Deliveries and absorption decline
- Rental rates up 8.7% for year
Houston Highlights
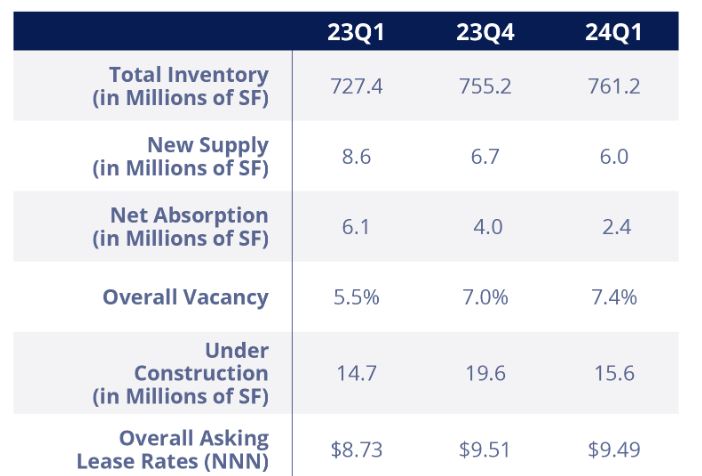
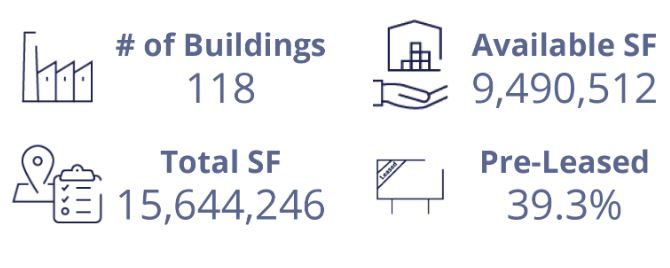
The industrial market started the year continuing its slowdown trend of 2023, reporting reduced activity on all levels during the first quarter. New supply outpaced net absorption, with the first quarter reporting new product of 6.0M SF, 60.0% more than the 2.4M SF absorbed. This level of absorption was last seen back in 2020-2021. Leasing activity fell to 8.2M SF, 40.6% down from the prior quarter and 29.3% down year-over year. The overall vacancy rate increased 40 basis points to 7.4% from 7.0% in fourth quarter with new deliveries contributing to the uptick at 28.2% preleased. Developers dropped the construction level to 15.6M SF, down 56.6% year-over year and down 20.8% from the previous quarter, which should help stabilize future vacancy. Positive net absorption this quarter was 2.4M SF, 38.8% lower than the prior quarter. Rents nudged down to $9.49 NNN PSF from $9.51 NNN PSF last quarter but represent an 8.7% growth rate year-over year.
Market Indicators
Historic Comparison
Market Fundamentals

The industrial overall vacancy rate in Houston increased by 40 basis points during the first quarter with all activity indicators
reporting declines following a few years of record-setting, unsustainable levels.
Despite a construction slowdown during the last 12 months, completions continue to outpace demand.
Recent Transactions
*Colliers’ Transaction
![]()
Executive Summary
By Patsy Fretwell, Research Director
The Houston industrial market remains one of Houston’s best-performing product types even as signs of a slowdown continued into the new year. Healthy leasing activity and positive absorption accompany that slowdown along with developers responding to market fundamentals and reducing construction levels.
After undergoing two record-breaking years, this decreased construction pipeline could return the market to sustainable levels. The current pipeline of 15.6 million square feet is a 20.8% drop from the prior quarter and a 56.6% drop from a year ago. The restricted availability of both newly completed product and under-construction projects could help stabilize the overall market.
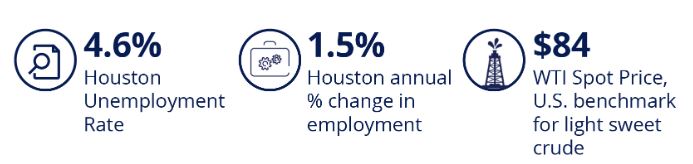
Economic trends
Local population growth continues with Houston cited as second among U.S. metros, adding 140,000 residents in 2023. Employment growth has also been steady, with recent revisions showing Houston creating 102,900 jobs in 2023, more than previously noted.
The Greater Houston Partnership has reported 139 new business announcements during the first quarter, with about 60% slated for manufacturing firms, distribution and warehouse facilities, and research and development.
The Port of Houston remains a key economic driver for the industrial market, with the Port reporting a 12% increase in container volume — 708,926 Twenty-Foot Equivalent Units (TEUs) — through February compared to the same period last year. The month of February is now noted as the biggest month for container exports on record with a 20% increase, while loaded imports also reported an 18% increase.
Project 11 is on track as the last contract for dredging is awarded, completing the first segment of a multi-year expansion project to deepen and widen the Houston Ship Channel by late 2026.
Supply and demand
At 6.0 million square feet, overall new supply has also declined during the last two quarters but has consistently outpaced net absorption, which is currently 2.4 million square feet, a 41.6% decrease from the previous quarter. Leasing activity at 8.2 million square feet is healthy but down from the 2023 quarterly leasing average of 11.7 million square feet.
This quarter’s activity was led by Dunavant Distribution’s renewal of 784,000 square feet in the Bay Area Business Park’s Building 10 in the Southeast and Solar Plus’ new 567,140-square-foot lease in Nexus North Logistics Park in the North.
Major move-ins representing the largest positive absorption for the quarter include Distribution Alternatives, 855,610 square feet in Kingsland Ranch Logistics Park in the Southwest and Imperial Dade’s 293,715 square feet in Lone Star Logistics Park in the South.
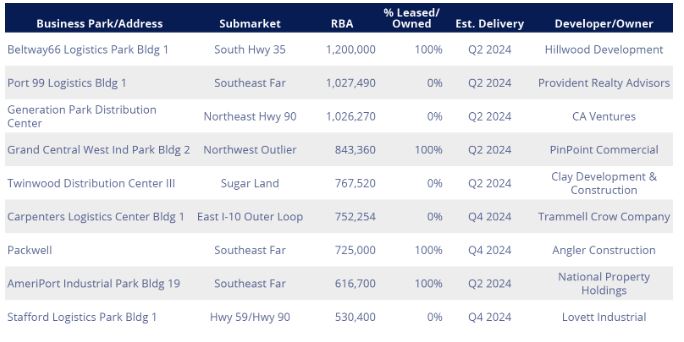
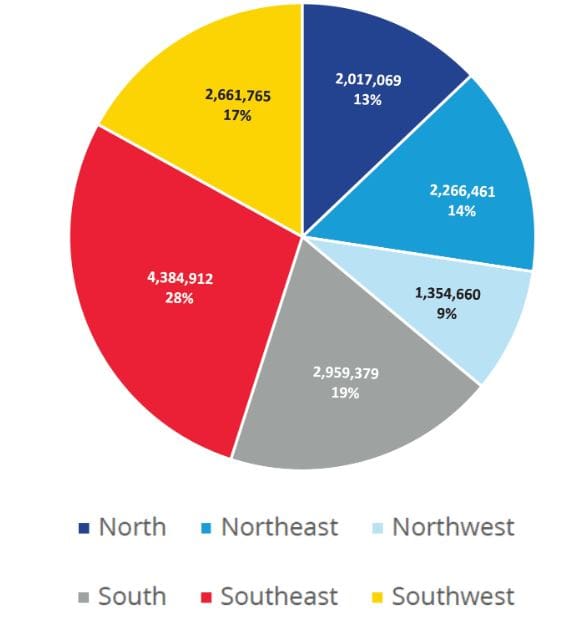
Driven by the Port of Houston’s ongoing expansion, the Southeast Corridor is leading all others year-to-date with 28.0% of square footage under construction and 27.9% of delivery totals.
For net absorption, the Southeast came in second behind the Southwest, the lone sector that recorded more absorption than deliveries, with almost 1.5 million square feet of absorption and 1.4 million square feet of new product.
Houston’s overall vacancy rate increased by 40 basis points to 7.4%, with new product vacancies of 61.8% playing a role in this uptick. Rents have been stable the last two quarters but represent an 8.7% increase year-over year.
Houston’s industrial market will continue to benefit from the area’s continued growth in population and employment along with the Port of Houston’s increased economic expansion. With a tightened spec development pipeline, vacancy should start reversing to a downward trend later this year.
Under Construction
Institutional Inventory – 500,000 SF or Greater
The buildings in the table below represent a sampling of the developments currently underway in Houston’s industrial market.
Construction Activity
Houston Industrial Construction
Construction by Submarket
Future Deliveries

Note: Includes all under-construction industrial and flex buildings 10,000+ SF
Source: CoStar