
The housing market of the last two years has been unusual in many ways. With constrained supply, intense demand, and record price growth, the market has consistently defied experts’ expectations and typical trends. And one way these aberrations have shown up is in seasonality.
Typically, the most active portion of the year is spring and summer. For most years in the last decade, monthly home sales peaked in the months of June, July, or August and receded over the course of the rest of the year. With more buyers looking for homes in peak months, competition also helps drive prices higher, and homes typically sell for more when the market is at its most active. But since 2020, seasonality in the market has been disrupted.
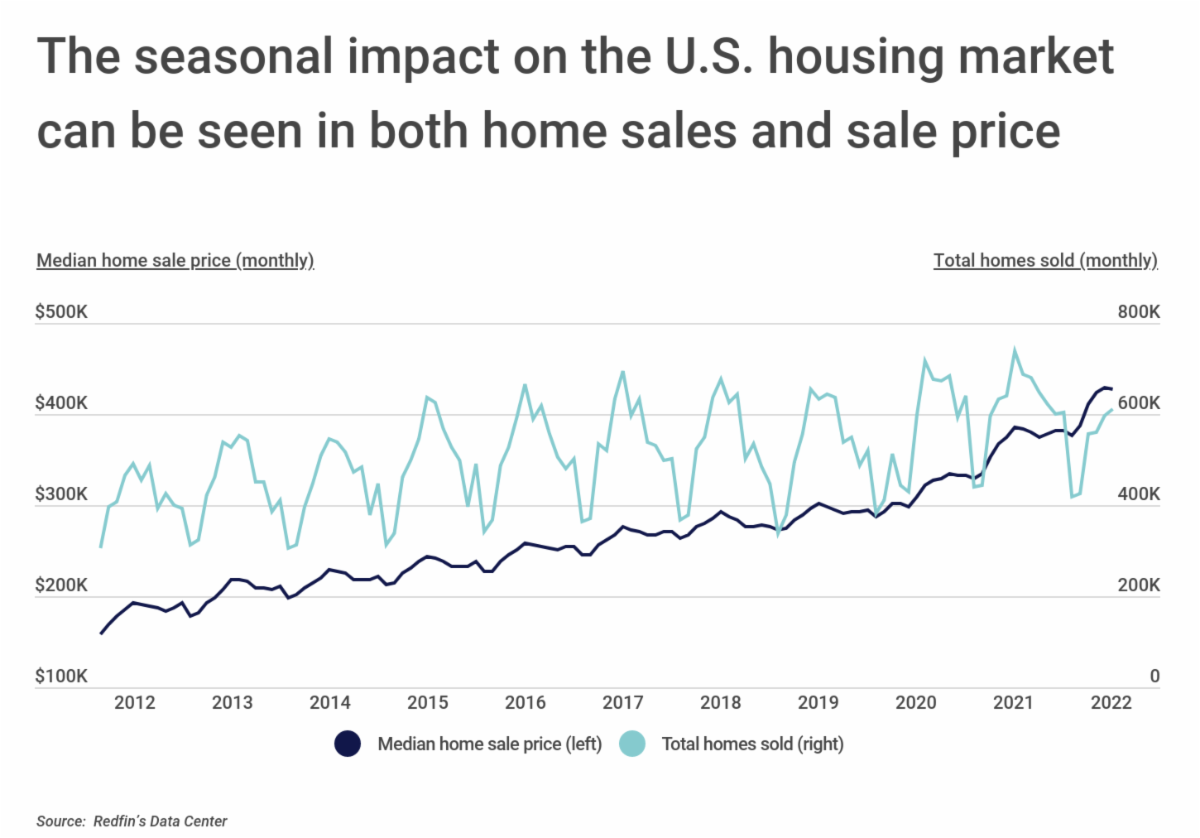 |
When the COVID-19 pandemic first hit in March 2020, home sales began to decline during a time of year when the market usually picks up. Home sales peaked again at 715,226 in July 2020 but fell off only slightly in fall and winter. In 2021, home sales were also elevated throughout the year, though the first few months of 2022 have shown more typical seasonal behavior.
The absence of seasonality is even more apparent in the growth of home prices. While price growth throughout the seasons has been more dramatic than usual over the last two years, home values remained flat or continued growing even in off months where prices typically decline. And more recently, high prices and interest rates have begun to cool the market, which has been unusual in a different way: median home sales prices declined slightly between May and June 2022, which has not occurred in any year for the last decade.
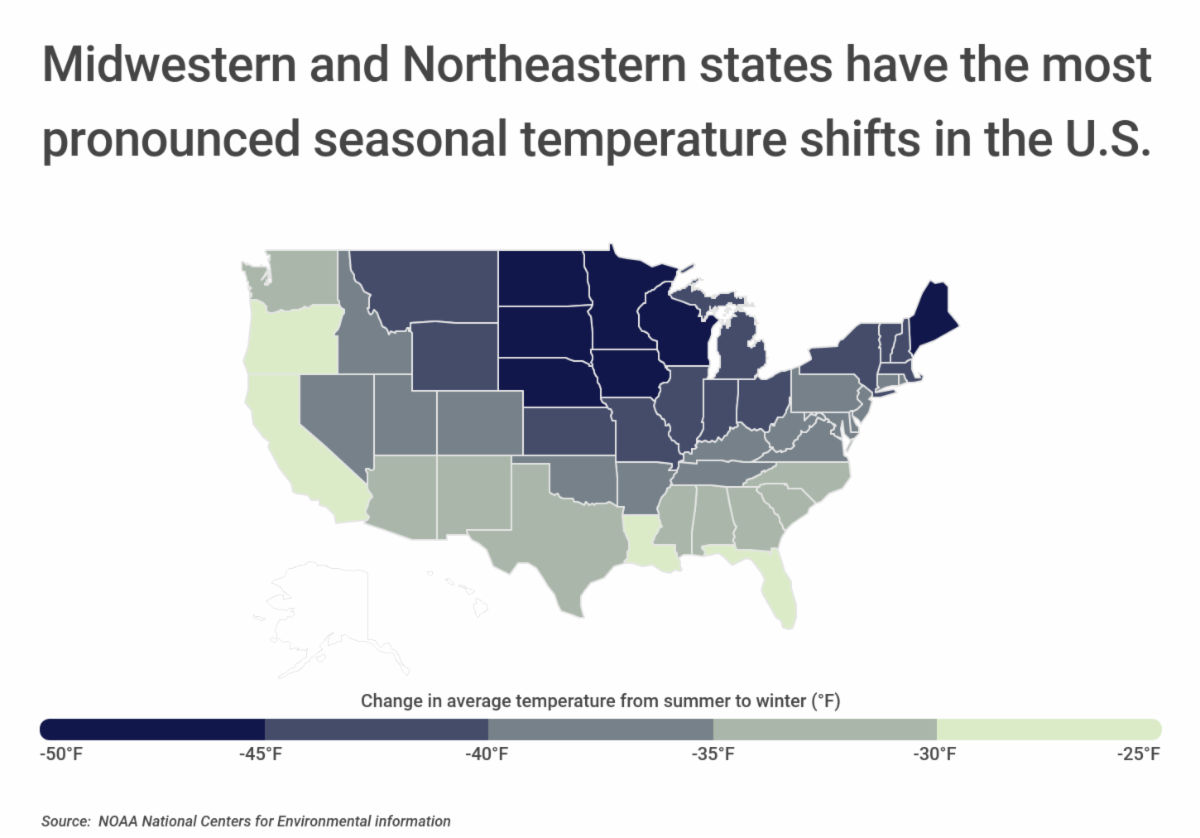 |
One major reason for seasonality in the real estate market is weather. Cold and wintry conditions can make it hazardous or simply undesirable for buyers to travel to tours, and sellers know that homes have more curb appeal when flowers are in bloom and lawns are lush.
Real estate seasonality can be more pronounced in locations that have especially dramatic transitions between summer and winter months, like the upper Midwest and Northeast. States in these regions can have average summer and winter temperatures that vary by more than 40 degrees—or even more, in the cases of North Dakota (53.7 degrees) and Minnesota (53.5).
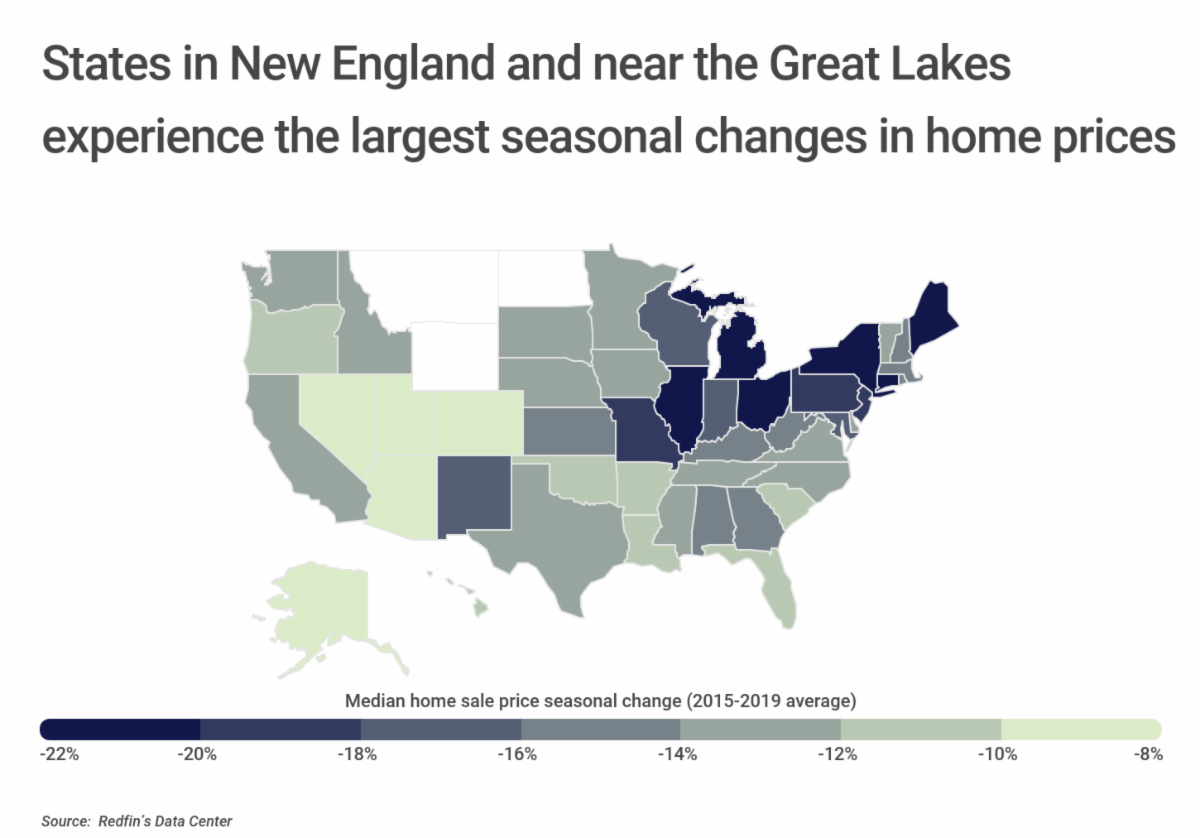 |
As such, most of the locations that have the greatest seasonal changes in home prices are found in the Northeast and around the Great Lakes. Maine—which has particularly harsh winters but pleasant, temperate summers—leads the nation with a 22.1% variation between summer and winter sales prices. Mountain West and Sun Belt states tend to show less variation, led by Colorado with just an 8.1% difference between summer and winter sales prices. While many of the locations with less variation have temperate climates year-round, one other factor may be competition. These states have also been fast-growing in recent years and may have more consistent demand for homes across the seasons as a result. Additionally, these states tend to attract visitors in the winter months—whether it be to participate in winter sports (as is the case for Colorado and Utah) or to enjoy warmer weather (as is the case for Arizona and Florida).
The Great Lakes also dominate the list of metros with the biggest seasonal changes in home prices. Ten of the top 15 large cities with the biggest seasonal changes in home prices—including each of the top 7—are all found in the Great Lakes region.
The data used in this analysis is from Redfin. To determine the locations with the biggest seasonal changes in home prices, researchers at Construction Coverage calculated the percentage change in median sale price between the most expensive month and the least expensive month in each location, averaged over the five-year period between 2015 and 2019. In the event of a tie, the location with the greater percentage change in days on market was ranked higher.
Here is a summary of the data for the Baltimore-Columbia-Towson, MD metro area:
- Median home sale price seasonal change (2015–2019 average): -18.2%
- Total days on market seasonal change (2015–2019 average): +141.4%
- Month for highest median home sale price (2015–2019 average): June
- Month for lowest median home sale price (2015–2019 average): February
- Median home sale price (current): $375,000
For reference, here are the statistics for the entire United States:
- Median home sale price seasonal change (2015–2019 average): -11.2%
- Total days on market seasonal change (2015–2019 average): +69.3%
- Month for highest median home sale price (2015–2019 average): June
- Month for lowest median home sale price (2015–2019 average): February
- Median home sale price (current): $428,379
For more information, a detailed methodology, and complete results, you can find the original report on Construction Coverage’s website: https://constructioncoverage.com/research/cities-with-the-biggest-seasonal-changes-in-home-prices